CIMA Part Three: PowerPivot ROI Comparison
CLICK IMAGE TO VIEW ARTICLE
It’s that time of the month again folks… you know… for the next installment in my series for CIMA Insight!
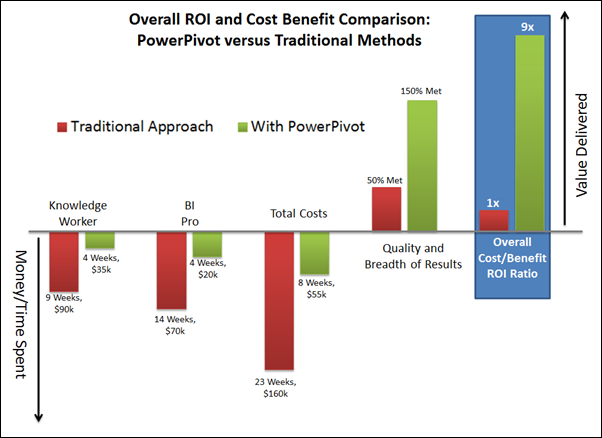
The overwhelming request from the CIMA crowd after they read Part One was to ask for proof of ROI. These are accountants, after all, and it’s a fair question.
Some of Pivotstream’s customers would be the most “neutral” source for this kind of evidence, but it is difficult to convince folks to take time out of their day to explain to the world what a great competitive advantage they have discovered ![]()
So I think we are going to explore some additional joint case studies with Microsoft, including a more vivid writeup of the Duane Reade case study (Pivotstream and DuaneReade jointly authored a 25-page whitepaper jammed with quotes, images, and a specific focus on PowerPivot, and the MS marketing machine distilled it to… something I don’t even recognize).
So Part Two, and now Part Three, are still very much informed by my experiences with all of our clients, but is grounded specifically in a project I have implemented both the traditional way and the PowerPivot way, which is, of course, The Great Football Project.
CIMA readers, I’m very hungry for feedback on part three – particularly on the topic of “should I continue with more ROI detail in part four, or should I start explaining the basics of how to quickly get started, from an Excel veterans’ point of view?”
Leave comments, send me email, whatever you are comfortable with. I want to know what would be the next best step, the most useful material for you.
