“I will start with the calculate curry. And a green tea.”
-Wise first time DAX customer
Is There a Preferred Way To Learn DAX Measures?
I’m glad you asked 🙂 Actually, I do get asked this quite often – in email, on Twitter, and in person at events like last week’s PASS Summit in Seattle. I promised the folks at my Birds of a Feather lunch table that I would blog about the approach that I take in my consulting/training engagements.
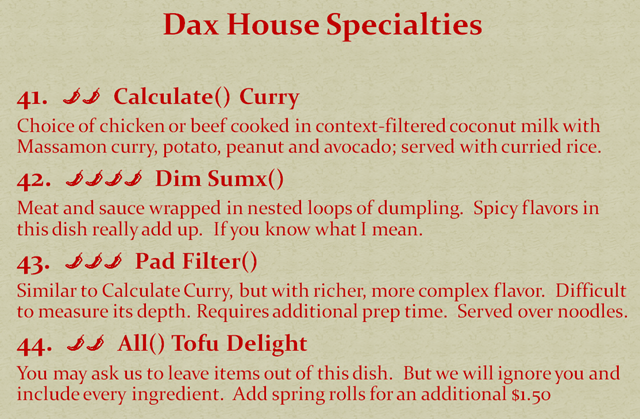
I then, of course, promptly forgot. Good thing Phil reminded me today in Twitter, because it gave me an opportunity to put together that menu mockup above. Which clearly is where my time is best spent while watching Monday Night Football.
So, here it is. The official P3 Adaptive technique, refined by decades spent in the trenches of DAX. But first, some background.
Sometimes, You Actually CAN Have Too Much of a Good Thing
If you read my post on the official Excel blog, you may remember me saying something to the effect that DAX measures are a feature so rich, it’s as if Excel had a whole team working on them for a decade, then delivered it all at once in a single release.
That’s obviously a good thing, but it also comes with a downside: it’s a lot to digest all at once. Most products give you the simple stuff in v1, then add some more power in v2, continue in v3, etc. – and the user base gets to grow their knowledge slowly over time.
Not so in PowerPivot v1. We’re basically looking at a version 5 product when it comes to DAX measures and all of the functions supported. So it’s a bit daunting – of all these many functions, which ones would have been released in v1, had we not skipped straight to v5?
Because, hey, those are the ones we want to learn first. But, they are hiding in there next to functions from v2 – v5, and the function names provide little clue as to complexity.
The Spicy Scale to the Rescue!
On Thursday night we had a very entertaining dinner with members of the PowerPivot/SSAS team. At my table, we discussed the idea of a spiciness scale for DAX functions, to help people approach them in the right order. It would be just like the spicy scale you see on menus at Chinese and Thai restaurants.
(I was suggesting the idea as something that might be useful in the product itself – I now have the luxury of just throwing out ideas at random, and my former colleagues decide whether it actually makes sense in the real world… in a sea of ideas coming from all directions. Their job is a LOT harder.)
Some amazing people in those pictures, including, but not limited to, people who get mentioned here all the time – Kasper (now on the PowerPivot team), Marco and Alberto, Marius of DAX Superhero fame… and that is leaving out some of my all-time favorite people.
OK, let’s dive in.
Spice Level One: Fundamentals, COUNTROWS, and DISTINCT
Before you get rolling, it is very important to understand how measures actually work. And while you’re at it, it helps to have a couple of new (but simple) functions to try out.
This explanation works best in video form, so I’ll direct you to my YouTube video on the topic.
Spice Level Two: CALCULATE
Now that you understand the basics of pivot cell context and how those filters apply to measures, it’s time to start overriding and modifying that filter context.
CALCULATE is the foundation for a whole world of magic, and it’s a lot like SUMIF, which is excellent news for Excel pros.
You can learn more about CALCULATE here, here, and here.
Also note that you don’t have to restrict yourself to the = operator here. You can use <, >, <=, >=, and <> as well.
Spice Level Three: ALL
Once you get comfortable setting fields to single values, the next expansion of your powers is removing filters altogether.
Spice Level Four and Beyond: “It Depends”
As I’ve mentioned before, the best way to learn is with your own data, rather than textbook cases. So I would let that be your guide.
Many people will probably want to experiment with time intelligence functions next, employing them to change date filter context in much the same way that ALL does… except with more specific, time-shifting results. I really should do a new series of posts just on time intelligence functions.
Or alternatively, do you want a measure that iterates over values that are NOT shown in your pivot? Or do you want a measure to be a MAX at the lowest level of the pivot but then a SUM at higher levels? If so, I recommend you try SUMX next.
Or maybe you want to revisit CALCULATE, and instead of setting fields to particular values, or even comparing then to particular values using <, >, <=, >=, or <>, let’s say you want to compare those fields to *measure* values? Well, you are ready for FILTER. Sort of 🙂
I will probably return to this subject in the future, time allowing, but for now, this is the gist of it. If you master levels 1-3, you have a tremendous amount of new power at your fingertips, and you are ready for new things, but it’s hard to cover any of those new things in a short paragraph or even a single link. I usually spend several hours on the level four stuff with my consulting/training clients, as a point of reference (and that is with the comfort of the clients’ own data and business problems).
